
Automating Your Management Dashboard: The Method to Run Your Business Without Losing Your Evenings
 Majdi ZarkounaCo-fondateur de Majoli.io
26% of French SMEs already use AI according to France Num, but few truly automate their management. The 5-step method to build a connected dashboard, with no technical skills required.
Why gut-feeling management quickly hits its limits
According to the France Num 2025 barometer, 26% of French small and medium businesses now report using at least one artificial intelligence tool, up from 13% a year earlier: adoption has doubled in twelve months. But that headline figure hides a significant gap depending on company size. In businesses with fewer than 10 employees, AI is mostly used to generate text, visuals, or to chat with a conversational assistant: an individual, often occasional use. By contrast, in SMEs with 50 to 249 employees (42% adoption), AI is already deployed for "analysis and forecasting, resource optimization, quality control and process automation," according to the same study.
In other words: the bigger a company grows, the more it turns its data into a genuine management tool. Smaller businesses, meanwhile, too often keep running the show on gut feeling, with a spreadsheet updated once a month if there is time. Yet a more structured use of AI and automation requires neither the budget of a 50-employee company nor advanced technical skills. Here is the method for building an automated dashboard, whatever the size of your business.
What is an automated dashboard, exactly?
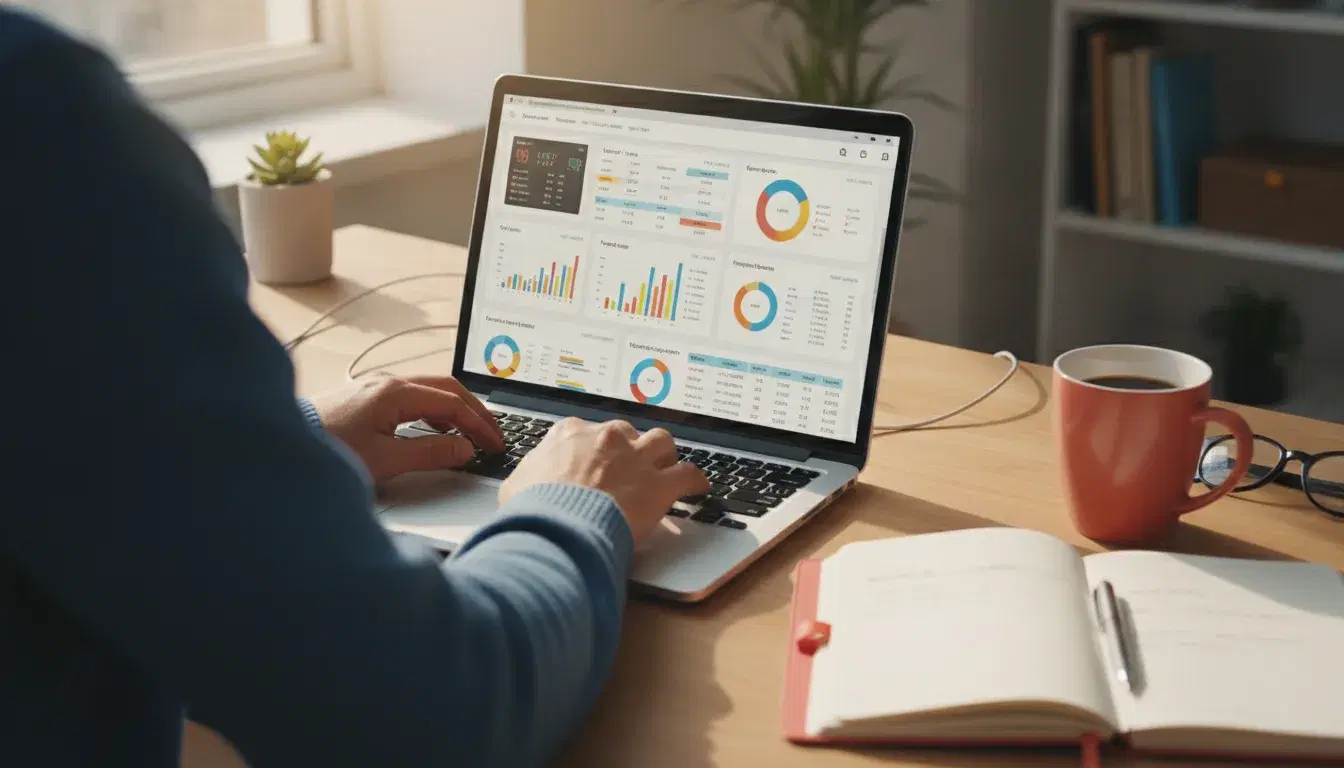
An automated dashboard is not an Excel file you export and copy over every month. It is a set of indicators connected directly to your data sources (invoicing, banking, CRM, website, social media) that update themselves, with no manual re-entry. The difference comes down to one word: connection. Where a classic spreadsheet freezes a snapshot at a given moment, an automated dashboard stays alive and reflects the real state of your business at the moment you check it.
That does not mean you need to invest in a complex tool. For a small business, an automated dashboard can fit on a single page, connected to three or four sources, and be more than enough to make better decisions every week.
Which indicators to automate first, depending on your business
Before choosing a tool, you need to know what to measure. A dashboard overloaded with indicators always ends up abandoned. Here, by type of activity, are the indicators that genuinely add value once automated.
For a retail business or an online store
Daily revenue by sales channel, website conversion rate, average basket size, stockout rate and average delivery time. This data already exists inside your sales platform: it just needs to be connected into a single dashboard rather than checked separately across tools. If your site does not yet expose these indicators clearly, it is worth reviewing your product and stock management features before automating the reporting that follows from them.
For a services or consulting business
Team utilization rate, average time between first contact and signature, current sales pipeline value, quote-to-close conversion rate. These are typically the indicators that stay stuck in the owner's head simply because they were never written down. An automated dashboard makes them visible at any moment, including for the employees who contribute to revenue.
For a trade or construction business
Number of quotes sent and followed up, conversion rate, margin per project, average customer payment delay. These indicators overlap directly with payment tracking: if you have already set up automated payment reminders, all that is left is to feed that data into a global dashboard rather than leaving it in an isolated tool.
The 5-step method for building your automated dashboard
Here is the process to follow, in order, to move from manual management to automated management without spending weeks on it.
- Take stock of your data sources. List the tools that already hold useful information: invoicing software, CRM, online banking, Google Analytics, e-commerce platform, appointment booking tool. Most of these tools now offer a direct export or connection.
- Choose an accessible visualization tool. There is no need to aim for a heavy business intelligence solution on day one. A connected spreadsheet or a free visualization tool is more than enough to get started, as long as the data refreshes itself.
- Connect the sources instead of copying them. This is the step that makes all the difference: use your tools' native connectors, or an automation service that syncs data between applications, to eliminate all manual re-entry.
- Set alert thresholds, not just figures. A useful dashboard does not just display a number: it flags when that number leaves the acceptable range (cash below a threshold, a falling conversion rate, an abnormal delivery delay).
- Review and simplify every quarter. An indicator that has not driven a single decision in three months should be removed. A good dashboard evolves with the business, it does not just accumulate.
Which tools to choose depending on your budget and technical level?
For a small business just starting out, a free visualization tool connected to your spreadsheets and Google accounts remains the simplest entry point: it can be set up in a few hours, with no particular technical skill required. For a more established business, fuller reporting solutions let you cross-reference several business sources (accounting, CRM, production) and share the dashboard with several employees.
Either way, the challenge is not finding the most sophisticated tool, but the one you and your team will actually check every week. Support with automation and artificial intelligence makes it possible to quickly identify the right connectors and avoid tools that are oversized for your actual needs.
The mistakes that make a dashboard useless
The first mistake is wanting to measure everything from the start: a dashboard with thirty indicators is checked by no one. The second is the lack of a clearly identified owner: without someone responsible for reviewing the figures every week, even a perfectly automated tool ends up ignored. The third mistake, more technical, concerns access rights: a dashboard that centralizes financial and commercial data must be protected just like your other management tools, with access limited to the people who need it.
Finally, poorly maintained automation quickly becomes misleading: a data source that silently disconnects can create a false sense of stability. Hence the value of the quarterly review mentioned above, which should also check that every connection still works. This same discipline applies to automating B2B prospecting or to automating appointment booking: automating a process never means you can stop overseeing it.
Automated management does not stop at internal figures either: tracking your Google ranking by keyword or your marketing indicators deserves just as much a place in a global dashboard as your revenue does. To go further on setting up this kind of automation, getting in touch lets you review your current tools and the connections available.
Review tracking deserves a place in this dashboard too: see how to automate Google review collection to feed this dashboard with a real-time reputation indicator.
Frequently asked questions
Do I need IT skills to automate my dashboard?
No. Today's visualization tools offer ready-made connectors to the most common invoicing software, CRMs or Google accounts. The initial setup is mostly a matter of method: knowing which data to connect and in what order, rather than development skills.
How long does it take to set up a first automated dashboard?
A first simple dashboard, connected to two or three sources, can be up and running within a few days. The difficulty is not technical but organizational: it lies in choosing the indicators that are genuinely useful, a step worth taking seriously before connecting any tools.
What is the difference between a dashboard and a simple monthly report?
A monthly report is a frozen snapshot, produced after the fact, often several days behind reality. An automated dashboard stays continuously up to date and lets you react before problems get worse, for example on a late payment or a drop in traffic.
Does an automated dashboard replace the accountant?
No, it complements them. The accountant remains responsible for legal and tax obligations. The dashboard, on the other hand, supports day-to-day operational management: it gives an immediate view of the business between two meetings with your accountant.
How do I know if my dashboard is still relevant in six months?
The simplest test is to ask, for each indicator displayed, what decision it enabled over the last quarter. If the answer is none, the indicator should be removed or replaced. This discipline of regular review is what separates a useful dashboard from one that is displayed but never actually read.
Besoin d'un accompagnement ?
Découvrir les services Majoli
Création de site web, SEO et automatisations IA : explore nos offres pour accélérer ta croissance.
Découvrir les services MajoliDécouvrir les derniers articles

September 16, 2026
How Much Does a Logo and Brand Identity Redesign Cost in 2026?
A logo redesign can cost 200 euros or 30,000 euros depending on the provider. The complete guide to 2026 pricing, hidden costs, redesign steps and mistakes to avoid when rebranding.
September 15, 2026
Automating Quotes in Small Businesses: The 5-Step Method to Save Time and Sign Faster in 2026
68% of clients request 3 to 5 quotes before deciding (CAPEB), and 41% forget to respond without a follow-up. The complete method for automating quote creation, sending, signing and follow-up.
September 14, 2026
RGAA Digital Accessibility: The 2026 Guide to Website Compliance
Since June 28, 2025, the European Accessibility Act extends the RGAA to private businesses, with fines of up to 50,000 euros per service. The 5-step method to reach compliance in 2026.